Publications (Data&Codes)
(Note: Some pdf files below are the sole copyright of the respective
publishers, and are provided here for educational use only.)
|
Anomalies as New Hedge Fund Factors
with Yong Chen, Sophia Zhengzi Li and Yushan Tang
(9 New Hedge Fund Factors: Data)
|
|
We identify a parsimonious set of factors from a large set of candidates for explaining hedge fund returns, ranging from equity market, anomaly and trend-following factors to macroeconomic factors. The resulting nine-factor model, including five anomaly factors, outperforms existing hedge fund models both in-sample and out-of-sample, with a significant reduction in alphas while showing substantial cross-sectional performance heterogeneity. Further analysis based on fund holdings confirms the model’s ability to capture returns from arbitrage trading. Overall, the anomaly factors help quantify hedge fund strategies and risk exposures and improve fund performance evaluation.
Journal of Financial and Quantitative Analysis, forthcoming.
|
|
Investor Sentiment and Asset Returns: Actions Speak Louder than Words
with Xi Dong, Dat Mai and Kuntara Pukthuanthong
|
|
The article studies daily predictability of investor sentiment
across four major asset classes and compare sentiment measures based
on news and social media with those based on trade information. For
the majority of assets, trade-based sentiment measures outperform
their text-based equivalents for both in-sample and out-of-sample
predictions. This outperformance is particularly noticeable in
long-term forecasts. Real-time mean–variance investors, however, can
only achieve economic gains using Bitcoin trade sentiment,
suggesting the challenge of transforming sentiment into daily
profitable trading strategies.
Journal of Portfolio Management, forthcoming.
|
|
Do Option Characteristics Predict the Underlying Stock Returns in the Cross-Section?"
with Andreas Neuhierl, Xiaoxiao Tang and Rasmus Tangsgaard Varneskov
|
|
We provide the first comprehensive analysis of options-implied information for predicting the cross-section of stock returns. Based on an extensive set of both firm and option characteristics and using traditional portfolio sorts and modern high-dimensional methods, we find that option information matters. However, in contrast to existing studies, there are only a few option characteristics that have significant incremental predictive power after controlling for the large set of firm characteristics. Further structural analysis reveals that the strongest option characteristics are associated with asset mispricing, future tail return realizations and short-selling costs. Our findings are consistent with models of informed trading and limits to arbitrage.
Management Science, forthcoming.
|
|
Why Naive 1/N Diversification Is Not So Naive, and How to Beat It?
with Ming Yuan
|
|
We show theoretically that the usual estimated investment strategies will not achieve the optimal
Sharpe ratio when the dimensionality is high relative to sample
size, and the 1/N rule is optimal in a one-factor model with
diversifiable risks as dimensionality increases, which explains why
it is difficult to beat the 1/N rule in practice. We also explore
conditions under which it can be beaten, and find that we can
outperform it by combining it with the estimated rules when N is
small, and by combining it with anomalies or machine learning
portfolios, conditional on the profitability of the latter, when N
is large.
Journal of Financial and Quantitative Analysis, 59, 2024, 3601--3632.
|
|
Cross-Sectional Expected Returns: New Fama-MacBeth
Regressions in the Era of Machine Learning
with Yufeng Han, Ai He and David Rapach
(Online Appendix)
(Code for the new method)
|
|
We extend the Fama-MacBeth regression framework for cross-sectional return prediction to incorporate big data and machine learning. Our extension involves a three-step procedure for generating return forecasts based on Fama-MacBeth regressions with regularization and predictor selection as well as forecast combination and encompassing. As a byproduct, it provides estimates of characteristic payoffs. We also develop three performance measures for assessing cross-sectional return forecasts, including a generalization of the popular time-series out-of-sample R2 statistic to the cross section. Applying our extension to over 200 firm characteristics, more than double the maximum number previously studied, our cross-sectional return forecasts significantly improve out-of-sample predictive accuracy and provide substantial economic value to investors. Overall, our results suggest that a relatively large number of characteristics matter for determining cross-sectional expected returns. Our new method is
straightforward to implement and interpret, and it performs well in our application.
Review of Finance, 28, 2024, 1807--1831.
|
|
Mispricing and Anomalies: An Exogenous Shock to Short Selling from JGTRRA
with Yufeng Han, Yueliang (Jacques) Lu and Weike Xu
(Data)
|
|
We investigate the causal impact of short-sale constraints on market anomalies by analyzing a comprehensive set of 182 anomalies. Our approach leverages a persistent, robust, and plausibly exogenous shock to short-selling supply caused by the dividend tax law change in the Job and Growth Tax Relief Reconciliation Act (JGTRRA) of 2003. Our findings reveal that anomalies decline after JGTRRA. However, this tax law change impedes arbitrageurs’ ability to correct mispricing, resulting in anomalies decaying less following dividend record months compared to other months post-JGTRRA. Furthermore, this effect is concentrated on overpriced stocks as opposed to underpriced stocks. Interestingly, while this shock significantly affects most types of anomalies, valuation anomalies remain unaffected.
Journal of Empirical Finance 78, 2024, 101537.
|
|
Trend Factor in China: The Role of Large Individual Trading
with Yang Liu and Yingzi Zhu
(Factor Data: monthly and daily)
(Online-Appendix)
|
|
We propose a novel trend factor for the Chinese stock market, which incorporates both price and
volume information to capture dominant individual trading, momentum, and liquidity. We find
that volume plays a more significant role in the trend factor for China than for the US, reflecting
the greater retail participation in China. By incorporating this trend factor into the 3-factor model
of Liu et al. (2019), we propose a 4-factor model that explains a wide range of stylized facts and
60 representative anomalies. Our study highlights the important role of individual trading in asset
pricing, especially in China.
Review of Asset Pricing Studies 14, 2024, 348--380.
|
|
Asset Pricing: Cross-section Predictability
with Paolo Zaffaroni
|
|
We provide a selected review of the vast literature on cross-section predictability. We focus on
the state of art methods used to forecast the cross-section of stock
returns with man predictors and are primarily interested in the
ideas, methods, and their applications. To understand the
cross-section predictability, we also provide a review of factor
models, which shed light on whether the predictability is due to
mispricing or risk exposure.
Oxford Research Encyclopedia of Economics and Finance, 2024, 1--35.
|
|
Winners from Winners: A Tale of Risk Factors
with Siddhartha Chib and
Lingxiao Zhao
|
|
Starting from the twelve distinct factors from Fama and French (1993, 2015, 2018), Hou, Xue, and Zhang (2015), Stambaugh and Yuan (2017), and Daniel, Hirshleifer, and Sun (2020), plus twelve principal components of anomalies unexplained by the initial factors, a Bayesian comparison of approximately 17 million models in terms of marginal likelihoods and posterior model probabilities shows that {Mkt, MOM, IA, ROE, MGMT, PERF, PEAD, FIN} plus the nonconsecutive principal components, {PC1, PC5, PC7} are the best supported risk-factors. Pricing tests and annualized out-of-sample Sharpe ratios for tangency portfolios suggest that this asset pricing model should be used for computing expected returns, assessing investment strategies and building portfolios.
Management Science 70, 2024, 396--414.
|
|
Technical Analysis in the Stock Market: A Review
with Yufeng Han, Yang Liu and Yingzi Zhu
|
|
Technical analysis is the study for forecasting future asset prices with past data. In this survey, we review and extend studies on not only the time-series predictive power of technical indicators on the aggregated stock market and various portfolios, but also the cross-sectional predictability with various firm characteristics. While we focus on reviewing major academic research on using traditional technical indicators, but also discuss briefly recent studies that apply machine learning approaches, such as Lasso, neural network and genetic programming, to forecast returns both in the time-series and in the cross-section.
Handbook of Investment Analysis, Portfolio Management, and Financial Derivatives, 2024, 1893--1928.
|
|
Diagnostics for Asset Pricing Models
with Ai He
|
|
The validity of an asset pricing model implies white-noise pricing errors (PEs). However, we find that the PEs of six well-known factor models all exhibit a significant reversal pattern and are predictable by their lagged values in 3, 6, 9, and 12 months. Moreover, the predictability of the PEs can produce substantial profits. Similar conclusions hold for recently developed machine learning models too. Additional analysis reveals that the significant PE profits cannot be explained by investor sentiment and limits-to-arbitrage. Our results imply that much remains to be done in developing new asset pricing models.
Financial Management 52, 2023, 617--642.
|
|
Are Bond Returns Predictable with Real-Time Macro Data?
with Dashan Huang, Fuwei Jiang, Kunpeng Li and Guoshi Tong
|
|
We investigate the predictability of bond returns using real-time
macro variables and consider the possibility of a nonlinear
predictive relationship and the presence of weak factors. To address
these issues, we propose a scaled sufficient forecasting (sSUFF)
method and analyze its asymptotic properties. Using both the
existing and the new method, we find empirically that real-time macro variables
have significant forecasting power both in-sample and
out-of-sample. Moreover, they generate sizable economic values, and
their predictability is not spanned by the yield curve. We also
observe that the forecasted bond returns are countercyclical, and
the magnitude of predictability is stronger during economic
recessions, which lends empirical support to well-known macro
finance theories.
Journal of Econometrics 236, 2023, 105438.
|
|
Shrinking Factor Dimension: A Reduced-Rank Approach
with Ai He, Dashan Huang and Jiaen Li
(Data;
code)
(On-line Appendix)
|
|
We provide a reduced-rank approach (RRA) to extract a few factors from a large set of factor proxies, and apply the extracted factors to model the cross section of expected stock returns. Empirically, we find that the RRA five-factor model outperforms the well known Fama-French five-factor model as well as the corresponding PCA, PLS and LASSO models for pricing portfolios. However, at the stock level, our RRA factor model still has large pricing errors even after adding more factors, suggesting that the representative factor proxies of our study do not have sufficient information for pricing individual stocks.
Management Science 69, 2023, 5501--5522.
|
|
Employee Sentiment and Stock Returns
with Jian Chen, Guohao Tang and Jiaquan Yao
(Online Appendix)
(Data: 200806-202012)
|
|
We propose an employee sentiment index, complementing investor sentiment and manager sentiment indices, and find that high employee sentiment predicts low monthly (weekly) market returns significantly both in- and out-of-sample. The predictability can also deliver sizable economic gains for mean-variance investors in asset allocation. The impact of employee sentiment is found stronger among employees who work in the headquarters state and are less experienced. The economic driving force of the predictability is unique: high employee sentiment leads to high contemporaneous wage growth due to immobility, which subsequently results in lower firm cash flow and lower stock returns.
Journal of Economic Dynamics and Control 149, 2023, 104636.
|
|
Firm Fundamentals and the Cross Section of Implied Volatility Shapes
with
Ding Chen and Biao Guo
|
|
With machine learning tools, we document that firm fundamentals
have explanatory power on the shape of the option implied volatility
(IV) curve that is both economically and statistically significant.
We find further that, after accounting for fundamentals, the
associated IV process can generate overreaction in the long-term IV
with respect to change in the short-term IV, and can allow a
positive profit from at-the-money straddle writing, explaining
puzzling patterns of the literature. We also provide a simple model
linking the IV to firm fundamentals, which permits realistic IV
curves and is consistent with the empirical findings.
Journal of Financial Markets 63, 2023, 100771.
|
|
Recovering the FOMC Risk Premium
with
Hong Liu and Xiaoxiao Tang
(FOMC Risk Premia)
|
|
The Federal Open Market Committee (FOMC) meetings are among the most important economic events. We propose a novel method to recover the FOMC risk premium and drift sizes. Empirically, we find that for the 192 meetings from 1996 to 2019, the FOMC risk premium varies across meetings, from 1 to 326 basis points (bps) with an average of 45 bps. We obtain an out-of-sample R-squared of 7.51% when using the recovered FOMC premium to predict the meeting returns around the announcement. The average predicted upward drift size is 101 bps, and the average predicted downward drift size is 129 bps, matching well with the realized ones.
Journal of Financial Economics 145, 2022, 45--68.
|
|
Asset Pricing: Time-Series Predictability
with David Rapach
|
|
Asset returns change with fundamentals and other factors such as technical information and sentiment over time. In this survey, we review some of the major ideas, data, and methods used to model time-varying expected returns. We focus on the out-of-sample predictability of the aggregate stock market return via extensions of the conventional predictive regression approach. The extensions are designed to improve out-of-sample performance in realistic environments characterized by large information sets and noisy data.
Oxford Research Encyclopedia of Economics and Finance, 2022, 1--34.
|
|
Predictive Information in Corporate Bond Yields
with Xu Guo, Hai Lin and Chunchi Wu
(Data and SAS Program
Internet Appendix)
|
|
We document strong evidence of cross-sectional predictability of corporate bond returns based on a set of yield predictors that capture the information in the yields of past 1, 3, 6, 12, 24, 36 and 48 months. Return predictability is economically and statistically significant, and is robust to various controls. The uncovered predictability presents the most pronounced anomaly in the corporate bond literature that challenges rational pricing models.
Journal of Financial Markets 59, 2022, 100687.
|
|
Expected Return, Volume, and Mispricing
with
Yufeng Han,
Dashan Huang and Dayong Huang
(On-line Appendix)
(main data and codes)
|
|
We find that expected return is related to trading volume positively among underpriced stocks but
negatively among overpriced stocks. As such, trading volume amplifies mispricing. Our results
are robust to alternative mispricing and trading volume measures, alternative portfolio formation
methods, and controlling for variables that are known to have amplification effects on mispricing.
By attributing trading volume to investor disagreement, we show that our results are consistent
with the recent theoretical model of Atmaz and Basak (2018) in that investor disagreement predicts
stock returns conditional on expectation bias.
Journal of Financial Economics 143, 2022, 1295--1315.
|
|
Investor Attention and Stock Returns
with Jian Chen, Guohao Tang and
Jiaquan Yao
(On-line Appendix)
(Attention Index Data: 1980 to 2017)
|
|
We propose an investor attention index based on proxies in the literature, and find that it predicts
the stock market risk premium significantly, both in-sample and
out-of-sample, while every proxy individually has little predictive
power. The index is extracted by using the partial least squares,
but the results are similar by using the scaled principal component
analysis. Moreover, the index can deliver sizable economic gains for
mean-variance investors in asset allocation. The predictive power of
the investor attention index stems primarily from the reversal of
temporary price pressure and from the stronger forecasting ability
for high-variance stocks.
Journal of Financial and Quantitative Analysis 57, 2022, 455--484.
|
|
Optimal Portfolio Choice with Estimation Risk: No Risk-free Asset Case
with Raymond Kan and Xiaolu Wang
(Internet Appendix)
|
|
We propose an optimal combining strategy to mitigate estimation risk for the popular mean-variance portfolio choice problem in the case without a risk-free asset. We find that our strategy performs well in general, and it can be applied to known estimated rules and the resulting new rules outperform the original ones. We further obtain the exact distribution of the out-of-sample returns
and explicit expressions of the expected out-of-sample utilities of the combining strategy, providing not only a fast and accurate way of evaluating the performance but also analytical insights into the portfolio construction.
Management Science 68, 2022, 2047--2068.
|
|
Scaled PCA: A New Approach to Dimension Reduction
with Dashan Huang, Fuwei Jiang, Kunpeng Li and Guoshi Tong
(Internet Appendix)
(Demo Code in Matlab)
|
|
We propose a novel modification to the popular principal component analysis (PCA) by scaling each predictor with its predictive slope on the target to be forecasted. Unlike the PCA that maximizes the common variation of predictors, our scaled PCA, sPCA, puts more weights on those predictors that have stronger forecasting power. Asymptotically, we provide a set of sufficient conditions under which the sPCA forecast outperforms the PCA and partial least squares (PLS) forecasts. Simulated and real data show that the sPCA forecast outperforms the PCA forecast in general, and performs similarly as, and in some cases better than, the PLS forecast.
Management Science 68, 2022, 1678--1695.
|
|
Anomalies and the Expected Market Return
with Xi Dong, Yan Li and David Rapach
(On-line Appendix;
(code)
|
|
We provide the first systematic evidence on the link between long-short anomaly portfolio returns—a cornerstone of the cross-sectional literature—and the time-series predictability of the aggregate market excess return. Using 100 representative anomalies from the literature, we employ a variety of shrinkage techniques (including machine learning, forecast combination, and dimension reduction) to efficiently extract predictive signals in a high-dimensional setting. We find that long-short anomaly portfolio returns evince statistically and economically significant out-of-sample predictive ability for the market excess return. Economically, the predictive ability of anomaly portfolio returns appears to stem from asymmetric limits of arbitrage and overpricing dominance.
Journal of Finance 77, 2022, 639--681.
|
|
Unspanned Global Macro Risks in Bond Returns
with Feng Zhao and Xiaoneng Zhu
(Internet Appendix)
|
|
We examine the macro-spanning hypothesis for bond returns in international markets. Based
on a large panel of real-time macro economic variables that are not subject to revisions, we find
that global macro factors have predictive power for bond returns unspanned by yield factors.
Furthermore, we estimate macro-finance term structure models with the unspanned global macro
factors and find that the global macro factors in.uence the market prices of level and slope risks
and induce co-movements in forward term premia in global bond markets.
Management Science 67, 2021, 7825--7843.
|
|
Anomalies Enhanced: A Portfolio Re-balancing Approach
with Yufeng Han and Dayong Huang
(Internet Appendix)
|
|
Many anomalies are based on firm characteristics and are rebalanced yearly, ignoring any information during the year. In this paper, we provide dynamic trading
strategies to rebalance the anomaly portfolios monthly. For eight major anomalies, we
find that these dynamic trading strategies substantially enhance their economic importance, with improvements in the Fama and French (2015) five-factor risk-adjusted
abnormal return ranging from 0.40% to 0.75% per month. The results are robust
to a number of controls. Our findings indicate that many well known anomalies are
more profitable than previously thought, yielding new challenges for their theoretical
explanations.
Financial Management 50, 2021, 371--424.
|
|
Learning and Predictability via Technical Analysis: Evidence from Bitcoin and Stocks with Hard-to-Value Fundamentals
with Andrew Detzel,
Hong Liu,
Jack Strauss and
Yingzi Zhu
|
|
What predicts returns on assets with "hard-to-value" fundamentals, such as Bitcoin and stocks in new industries? We propose perhaps the first equilibrium model that justifies the use of technical analysis endogenously via rational learning. We document that ratios of prices to their moving averages forecast daily Bitcoin returns in- and out-of-sample. Trading strategies based on these ratios generate an economically significant alpha and Sharpe ratio gains relative to a buy-and-hold position. Similar results hold for small-cap, young-firm, and low-analyst-coverage stocks as well as NASDAQ stocks during the dotcom era.
Financial Management 50, 2021, 107--137.
|
|
The Chinese Warrant Bubble: A Fundamental Analysis
with Yintian Wang and
Yingzi Zhu
|
|
We investigate the information content in Chinese warrant prices
based on an option pricing framework that incorporates
short-selling and margin-trading constraints in the underlying
stock market. We show that Chinese warrant prices can be explained
under this pricing framework. On the basis of this new model, we
develop a price deviation measure to quantify stock market
investor unobserved demand for short selling or margin trading due
to market constraints. We find that warrant-price deviations are
driven by underlying stock valuation to a great extent. Chinese
warrant prices, save for the time around expiration dates, are
better characterized as derivatives than as pure bubbles.
Journal of Futures
Markets 41, 2021, 3--22.
|
|
Time-Series and Cross-Sectional Stock Return Forecasting: New Machine Learning Methods
with David Rapach
|
|
This paper extends the machine learning methods developed in Han, He, Rapach and Zhou (2019) for forecasting cross-sectional stock returns to a time-series context. The methods use the elastic net to refine the simple combination return forecast from Rapach et al. (2010). In a time-series application focused on forecasting the US market excess return using a large number of potential predictors, we find that the elastic net refinement substantively improves the simple combination forecast, thereby providing one of the best market excess return forecasts to date. We also discuss the cross-sectional return forecasts developed in Han et al. (2019), highlighting how machine learning methods can be used to improve combination forecasts in both the time-series and cross-sectional dimensions. Overall, because many important questions in finance are related to time-series or cross-sectional return forecasts, the machine learning methods discussed in this paper should provide valuable tools to researchers and practitioners alike.
"Machine Learning in Asset Management"
(edited by Emmanuel Jurczenko; Wiley, 2020), 1--33.
|
|
Time-Series Momentum: Is It There?
with Dashan Huang. Jiangyuan Li, and Liyao Wang
(Data and Matlab Program)
(Python Program)
(Internet Appendix)
(Discussions at Alpha Architect)
|
|
Time-series momentum (TSM), which refers to the predictability of the past 12-month return on the next one-month return, is the focus of quite a few recent influential studies. This paper shows, however, that asset by asset time-series regressions reveal little TSM both in- and out-of-sample. In a pooled regression, the usually used t-statistic can over-reject the no predictability hypothesis, and three versions of bootstrap corrected t-statistics show that there is no TSM. From an investment perspective, although the TSM strategy is known to be profitable, it performs the same as a similar strategy based on historical mean that does not require predictability. Overall, the evidence on TSM is quite weak, especially for the large cross section of assets.
Journal of Financial
Economics 135, 2020, 774--794.
|
Stock Return Asymmetry: Beyond Skewness
with Lei Jiang, Ke Wu, and Yifeng Zhu
|
|
In this paper, we propose two asymmetry measures for stock returns. Unlike the
popular skewness measure, our measures are based on the distribution function of the
data rather than just the third central moment. We present empirical evidence that
greater upside asymmetries calculated using our new measures imply lower average
returns in the cross-section of stocks. In contrast, when using the skewness measure,
the relationship between asymmetry and returns is inconclusive.
Journal of Financial and Quantitative Analysis 55, 2020, 357--386
|
|
Volatility-Managed Portfolio: Does It Really Work?
with Fang Liu and Xiaoxiao Tang
(Data and Program)
(On-line Appendix)
|
|
In this article, the authors find that a typical application of volatility-timing
strategies to the stock market suffers from a look-ahead bias, despite existing
evidence on successes of the strategies at the stock level. After correcting
the bias, the strategy becomes very difficult to implement in practice as its
maximum drawdown is 68.93% in almost all cases. Moreover, the strategy
outperforms the market only during the financial crisis period. The authors
also consider three alternative volatility-timing strategies and find that they
do not outperform the market either. Their results show that one cannot easily
beat the market via timing the market alone.
Journal of Portfolio Management 46 (1), 2019, 38--51
|
|
Industry Return Predictability: A Machine Learning Approach
with
David Rapach,
Jack Strauss and Jun Tu
(Data & code)
(Internet Appendix)
|
|
We use machine learning tools to analyze industry return predictability based on the
information in lagged industry returns. Controlling for post-selection inference and
multiple testing, we find significant in-sample evidence of industry return predictability. Lagged returns for the financial sector and commodity- and material-producing
industries exhibit widespread predictive ability, consistent with the gradual diffusion
of information across economically linked industries. Out-of-sample industry return
forecasts that incorporate the information in lagged industry returns are economically valuable: controlling for systematic risk using leading multifactor models from
the literature, an industry-rotation portfolio that goes long (short) industries with
the highest (lowest) forecasted returns delivers an annualized alpha of over 8%. The
industry-rotation portfolio also generates substantial gains during economic downturns,
including the Great Recession.
Journal of Financial
Data Science 1 (3), 2019, 9--28.
|
|
Manager Sentiment and Stock Returns
with Fuwei Jiang, Joshua Lee and Xiumin Martin
(Updated paper, Nov. 15, 2019)
(MS Index Data; updated to Dec., 2017)
|
|
This paper constructs a manager sentiment index based on the aggregated textual tone of corporate
financial disclosures. We find that manager sentiment is a strong negative predictor of future aggregate stock market
returns, with monthly in-sample and out-of-sample R-squared of 9.75% and 8.38%, respectively, which is far greater than
the predictive power of other previously-studied macroeconomic variables. Its predictive power is economically
comparable and is informationally complementary to existing measures of investor sentiment. Higher manager sentiment precedes lower
aggregate earnings surprises and greater aggregate investment growth.
Moreover, manager sentiment negatively predicts cross-sectional stock returns, particularly for firms that
are difficult to value and costly to arbitrage.
Journal of Financial
Economics 132, 2019, 126--149.
|
|
Firm Characteristics and Chinese Stocks
with Fuwei Jiang and Guohao Tang
|
|
This paper presents a comprehensive study on predicting the cross section of Chinese stock market
returns with a large panel of 75 individual firm characteristics. We use not only the traditional Fama-MacBeth
regression, but also the “big-data” econometric methods: principal component analysis (PCA), partial least
squares (PLS), and forecast combination to extract information from all the 75 firm characteristics. These
characteristics are important return predictors, with statistical and economic significance. Furthermore, firm
characteristics that are related to trading frictions, momentum, and profitability are the most effective predictors
of future stock returns in the Chinese stock market.
Journal of Management Science and Engineering 3, 2018, 259--283.
|
|
Measuring Investor Sentiment
|
|
Investor sentiment indicates how far an asset value
deviates from its economic fundamentals.
In this paper, we review various measures
of investor sentiment based on
market, survey, and media data, respectively.
While much progress has been made that contributes to our understanding of the pricing of difficult to-value assets,
anomalies, and predictability, much remains to done. We
discuss various potential extensions and a number of issues for
future research.
Annual Review of Financial
Economics 10, 2018, 239--259.
|
|
Forecasting Corporate Bond Returns: An Iterated Combination Approach
with Hai Lin
and Chunchi Wu
(On-line Appendix)
|
|
Using a comprehensive data set and an array of 27 macroeconomic, stock and bond predictors, we find
that corporate bond returns are highly predictable based on an
iterated combination model. The large set of predictors outperforms
traditional predictors substantially, and predictability generated
by the model is both statistically and economically significant.
Stock market and macroeconomic variables play an important role in
forming expected bond returns. Return forecasts are closely linked
to the evolution of real economy. Corporate bond premia have strong
predictive power for business cycle and the primary source of this
predictive power is from the low-grade bond premium.
Management Science 64, 2018, 4218--4238.
|
|
Asymmetry in Stock Comovements: An Entropy Approach
with
Lei Jiang and Ke Wu
(On-line Appendix)
|
|
We provide an entropy approach for measuring asymmetric comovement between the return on a single asset and the market return. This approach yields a model-free test for stock return asymmetry, generalizing the correlation-based test proposed by Hong, Tu, and Zhou (2007). Based on this test, we find that asymmetry is much more pervasive than previously thought. Moreover, our approach also provides an entropy-based measure of downside asymmetric comovement. In the cross-section of stock returns, we find an asymmetry premium: high downside asymmetric comovement with the market indicates higher expected returns.
Journal of Financial
and Quantitative Analysis 53, 2018, 1479--1507.
|
|
Market Intraday Momentum
with Lei Gao, Yufeng Han and Sophia Zhengzi Li
(On-line Appendix)
|
|
Based on high frequency data of the S&P 500ETF from 1993--2013, we document an intraday momentum pattern: the first half-hour return on the market predicts the last half-hour return. The predictability, both statistically and economically significant, is stronger on more volatile days, on higher volume days, on recession days, on major macroeconomic news release days, and with more institutional trading activities. This intraday momentum is also present for ten other most actively traded domestic and international ETFs in the US, and for two major international equity index futures during their own first and last half-hours of trading. Theoretically, the intraday momentum is consistent with not only Bogousslavsky's (2016) model of portfolio infrequent rebalancing, but also a model in which some investors are late-informed and trade near the market close.
Journal of Financial
Economics 129, 2018, 394--414.
|
|
Upper Bounds on Return Predictability
with Dashan Huang
|
|
Can the degree of predictability found in the data be explained by existing asset pricing models? We provide two theoretical upper bounds on the R-squares of predictive regressions. Using data on the market and component portfolios, we find that the empirical R-squares are significantly greater than the theoretical upper bounds. Our results suggest that the most promising direction for future research should aim to identify new state variables that are highly correlated with stock returns, instead of seeking more elaborate stochastic discount factors.
Journal of Financial
and Quantitative Analysis 52, 2017, 401--425
|
|
Modeling Non-normality Using Multivariate t: Implications for Asset Pricing
with Raymond Kan
|
|
Many important findings in empirical finance are based on the normality
assumption, but this assumption is firmly rejected by the data due
to fat tails of asset returns. In this paper, we propose the use of
a multivariate t-distribution as a simple and powerful tool to examine
the robustness of results that are based on the normality assumption.
In particular, we find that, after replacing the normality assumption with
a reasonable t-distribution, the most efficient estimator of the expected return of
an asset is drastically different from the sample average return. For example,
the annual difference in the estimated expected returns under normal and t is
2.964% for the Fama and French's (1993, 1996) smallest size and book-to-market
portfolio. In addition, there are also substantial differences in estimating Jensen's
alphas, choosing optimal portfolios, and testing asset pricing models when
returns follow a multivariate t-distribution instead of a multivariate normal.
China Finance Review International 7, 2017, 2--32.
|
|
A Trend Factor: Any Economic Gains from Using Information over
Investment Horizons?
with Yufeng Han and Yingzi Zhu
(On-line Appendix)
(Trend Factor Data, from 1930 to 2014)
(Updated to 2017; still performs!)
|
|
In this paper, we provide a trend factor that captures simultaneously all three stock price trends: the short-, intermediate- and long-term.
It outperforms substantially the well-known short-term reversal, momentum and long-term reversal factors, which are based on the
three price trends separately, by more than doubling their Sharpe ratios. During the recent financial crisis, the trend
factor earns 0.75% per month, while the market loses -2.03% per month, the short-term reversal factor loses -0.82%, the
momentum factor loses -3.88% and the long-term reversal factor barely gains 0.03%. The performance of the trend factor is robust to alternative formations and to a variety of control variables. The trends over horizons are captured by moving averages of prices whose predictive power is justified by a proposed general equilibrium model. From an asset pricing perspective, the trend factor performs well in explaining cross-section stock returns.
Journal of Financial Economics 122(2), 2016, 352--375
|
Short Interest and Aggregate Stock Returns
with David Rapach and Matthew Ringgenberg
(On-line Appendix)
Recent Great Decline!
(Data to Dec 2023, and Matlab Program)
(Citations by Bloomberg and others)
|
|
We show that short interest is arguably the strongest known predictor of aggregate stock returns. Short interest outperforms a host of popular return predictors from the literature in both in-sample and out-of-sample tests, with annual in-sample and out-of-sample R2 statistics of 12% and 8%, respectively. In addition, short interest generates substantial utility gains: a mean-variance investor would be willing to pay over 300 basis points per annum to have access to the information in short interest. We employ a VAR decomposition to explore the economic source of short interest’s predictive power and find that it stems almost entirely from a cash flow channel. Overall, our evidence indicates that short sellers are informed traders who anticipate changes in future aggregate cash flows and associated changes in future market returns.
Journal of Financial Economics 121, 2016, 46--65
|
Fama-MacBeth Two-pass Regressions:
Improving Risk Premia Estimates
with Jushan Bai
|
|
In this paper, we provide the asymptotic theory for the
widely used Fama and MacBeth (1973)
two-pass regressions in the usual case of a large number of assets.
We find that the convergence of the OLS two-pass estimator depends critically on the time series sample size
in addition to the number of cross-sections. To accommodate typical relatively small
time series length, we propose new OLS and GLS estimators
that improve the small sample performances significantly.
Finance Research Letters 15, 2015, 31--40.
|
|
Investor Sentiment Aligned: A Powerful Predictor of Stock
Returns
with Dashan Huang, Fuwei Jiang and Jun Tu
(PLS index data updated to Dec., 2023)
|
|
We propose a new investor sentiment index that is aligned with the purpose of predicting the aggregate stock market.
By eliminating a common noise component in sentiment
proxies, the new index has much greater predictive power than existing sentiment indices both
in- and out-of-sample, and the predictability becomes both statistically and economically
significant. In addition, it outperforms well recognized macroeconomic variables and can also predict cross-sectional stock returns sorted by industry, size, value, and momentum.
The driving force of the predictive power appears stemming from investors' biased belief about future cash flows.
Review
of Financial Studies 28, 2015, 791--837.
|
|
Macroeconomic Volatilities and Long-run Risks of Asset Prices
with Yingzi Zhu
(On-line Appendix)
|
|
In this paper, motivated by existing and growing evidence on multiple
macroeconomic volatilities, we extend the long-run risks model
of Bansal and Yaron (2004) by allowing both a long- and a
short-run volatility components in the evolution of economic
fundamentals. With the extension, the new model is not only consistent with the volatility literature
that the stock market is driven by two, rather than one,
volatility factors, but also provides significant improvements in fitting
various patterns of equity and options data.
Management Science 61, 2015, 413--430.
|
|
Are There Trends in Chinese Stock Market?
(in Chinese)
with Yufeng Han, Xiongjian Wang and Heng-fu Zou
|
|
Most stock markets world wide have the momentum effect that stock
prices tend to move in the same direction half or a year ago, but
not in China. This is puzzling since Chinese stock market is neither
one of the most information transparent countries in the world, nor
dominated by institutional investors. However, once we consider
short-term trends captured by technical analysis, we do find that
the Chinese stock is as trending as most other markets, say the US.
The abnormal returns from short-term trend-following, the alphas,
are both economically and statistically significant. Our results
suggest that behavior finance and investment theory with
information inefficiency are as relevant in China as they are elsewhere in the
world.
Journal of Financial Research 12, 2014, 152--163.
|
|
Forecasting the Equity Risk Premium: The Role of Technical Indicators
with Christopher J. Neely,
David E. Rapach and Jun Tu
(On-line Appendix)
(The Data and Matlab Programs)
|
|
Academic research has extensively used macroeconomic variables to forecast the U.S. equity risk premium, with little
attention paid to the technical indicators widely employed by practitioners. Our paper fills this gap by comparing the
forecasting ability of technical indicators with that of macroeconomic variables. Technical indicators display
statistically and economically significant in-sample and out-of-sample forecasting power, matching or exceeding that of
macroeconomic variables. Furthermore, technical indicators and macroeconomic variables provide complementary information
over the business cycle: technical indicators better detect the typical decline in the equity risk premium near
business-cycle peaks, while macroeconomic variables more readily pick up the typical rise in the equity risk premium near
cyclical troughs. In line with this behavior, we show that combining information from both technical indicators and
macroeconomic variables significantly improves equity risk premium forecasts versus using either type of information alone.
Overall, the substantial countercyclical fluctuations in the equity risk premium appear well captured by the combined
information in macroeconomic variables and technical indicators.
Management Science 60, 2014,
1772--1791.
|
|
Strategy Diversification: Combining Momentum and Carry Strategies within a Foreign Exchange Portfolio
with Francis Olszweski
|
|
Hedge funds, such as managed futures, typically use two different types of
trading strategies: technical and macro/fundamental. In this article, we evaluate the impact
of combining the two strategies, and focus on, in particular, two common foreign exchange
trading strategies: momentum and carry. We find evidence that combining the strategies
offers a significant improvement in risk-adjusted returns. Our analysis, which uses data
spanning 20 years, highlights the potential benefits of achieving strategy-level diversification.
The point of the paper is to advocate the investment strategy of combining technicals with fundamentals
Journal of Derivatives and Hedge Funds 19, 2014, 311--320.
|
|
Forecasting Stock Returns
with David Rapach
(Data and Matlab Programs)
(Data and Python Programs)
(Publication Info)
|
|
We survey the literature on stock return forecasting, highlighting the challenges faced by forecasters as well as strategies for improving return forecasts. We focus on U.S. equity premium forecastability and illustrate key issues via an empirical application based on updated data. Some studies argue that, despite extensive in-sample evidence of equity premium predictability, popular predictors from the literature fail to outperform the simple historical average benchmark forecast in out-of-sample tests. Recent studies, however, provide improved forecasting strategies that deliver statistically and economically significant out-of-sample gains relative to the historical average benchmark. These strategies—including economically motivated model restrictions, forecast combination, diffusion indices, and regime shifts—improve forecasting performance by addressing the substantial model uncertainty and parameter instability surrounding the data-generating process for stock returns. In addition to the U.S. equity premium, we succinctly survey out-of-sample evidence supporting U.S. cross-sectional and international stock return forecastability. The significant evidence of stock return forecastability worldwide has important implications for the development of both asset pricing models and investment management strategies.
Handbook of Economic Forecasting, Volume 2A, Graham Elliott and Allan Timmermann (Eds.), Amsterdam: Elsevier (September 2013), 328–383.
|
|
A New Anomaly: The Cross-Sectional Profitability of Technical Analysis
with Yufeng Han and Ke Yang
|
|
In this paper, we document that an application of a moving average
timing strategy of technical analysis to portfolios sorted by
volatility generates investment timing portfolios that outperform
the buy-and-hold strategy substantially. For high volatility
portfolios, the abnormal returns, relative to the CAPM and the
Fama-French three-factor models, are of great economic significance,
and are greater than those from the well known momentum strategy.
Moreover, they cannot be explained by market timing
ability, investor sentiment, default and
liquidity risks.
Similar results also hold if the portfolios are sorted based on other
proxies of information uncertainty.
Journal of Financial
and Quantitative Analysis 48, 2013, 1433--1461.
|
|
The Supply Factor in the Bond Market: Implications for
Bond Risk and Return
with Longzhen Fan and Canlin Li
|
|
Recent empirical studies suggest that demand and supply factors
have important effects on bond yields. Both market segmentation and
preferred habitat hypothesis are used to explain these demand and
supply effects. In this paper, we use an affine preferred-habitat
term structure model and the unique Chinese bond market data to
study these two hypotheses. Chinese bond market is unique because
there exists an official term structure of lending rates, set
exogenously by the government, on preferred habitat investors'
alternative investments on loans. We show that demands of both the
preferred-habitat investors and the arbitrageurs affect bond yields
and returns. Moreover, we also find that the preferred-habitat
investors' alternative investment opportunities have expected effect
on bond yields and returns. We further show that the
preferred-habitat and demand factors improve bond pricing and return
predictability in a no-arbitrage term structure model. Variance
decomposition analysis shows that the preferred-habitat factor
explains an important part of bond yield variations.
Journal of Fixed Income 23, 2013, 62--81.
|
|
International Stock Return Predictability: What is the Role of the United States?
with David E. Rapach and Jack K. Strauss
(On-line Appendix)
(The Data and Matlab Programs)
| |
We present significant evidence of out-of-sample equity premium predictability for a host
of industrialized countries over the postwar period. There are important differences, however,
in the nature of equity premium predictability between the United States and other developed
countries. Taken collectively, U.S. economic variables are significant out-of-sample predictors
of the U.S. equity premium, while lagged international stock returns have no predictive power.
In contrast, lagged international stock returns-- especially lagged U.S. returns--substantially
outperform economic variables as out-of-sample equity premium predictors for non-U.S. countries,
pointing to a leading role for the United States with respect to international return predictability.
The leading role of the United States is consistent with information frictions in
international equity markets. In addition, the predictability patterns are enhanced during economic
downturns, linking return predictability to business-cycle fluctuations and the diffusion
of news on macroeconomic fundamentals across countries. The leading role of the United
States stands out during the recent global financial crisis: lagged U.S. stock returns deliver
especially sizable gains for forecasting the monthly equity premium in other countries, evidenced
by out-of-sample R2 statistics of 10% or greater, more than triple the postwar average.
Journal of Finance 68, 2013, 1633--1662.
|
|
Volatility Trading: What is the Role of the
Long-Run Volatility Component?
with Yingzi Zhu
|
|
In this paper, we study an investor's asset allocation problem
with a recursive utility and with tradable volatility that follows a two-factor stochastic volatility model.
Consistent with Liu and Pan (2003) and Egloff, Leippold, and Wu's (2009)
finding under the additive utility, we show that volatility trading
generates substantial hedging demand, and so the investor can benefit substantially from volatility trading.
However, unlike existing studies, we find that the impact of elasticity of intertemporal substitution on investment decisions
is of first-order importance in the two-factor stochastic volatility model
when the investor has access to the derivatives market to optimally hedge the persistent component of
the volatility shocks. Moreover, we study the economic impact of model and parameter misspecifications
and find that an investor can incur substantial economic losses if he
uses an incorrect one-factor model instead of the two-factor
model or if he incorrectly estimates one of the key parameters in
the two-factor model. In addition, we find that the elasticity of intertemporal substitution is a more sensible description
of an investor's attitude toward model and parameter misspecifications than the risk aversion parameter.
Journal of Financial and Quantitative Analysis 47, 2012, 273--307.
|
|
Tests of
Mean-Variance Spanning
with Raymond Kan
(Matlab Programs)
|
|
The paper presents a thorough study on the spanning:
points out years old errors in the literature and provides geometrical/economic
interpretations, small sample distributions and power analysis for
likelihood ratio, Wald, and Lagrange
multiplier tests, and a comparison among them and between
the stochastic discount factor approach, in addition to a new sequential test that weighs
explicitly economic significance into the size of the test.
Annals of Economics and Finance 13, 2012,
145--193.
|
|
How Predictable Is the Chinese Stock Market? (in Chinese)
with Jiang Fuwei,
David Rapach, Jack Strauss and Jun Tu
|
|
We analyze return predictability for the Chinese stock market, including the aggregate market portfolio and
the components of the aggregate market, such as portfolios sorted on industry, size, book-to-market and ownership
concentration. Considering a variety of economic variables as predictors, both in-sample and out-of-sample tests
highlight significant predictability in the aggregate market portfolio of the Chinese stock market and
substantial differences in return predictability across components. Among industry portfolios, Finance
and insurance, Real estate, and Service exhibit the most predictability, while portfolios of small-cap,
low book-to-market ratio and low ownership concentration firms also display considerable predictability.
Two key findings provide economic explanations for component predictability: (i) based on a novel out-of-sample
decomposition, time-varying systematic risk premiums captured by the conditional CAPM model largely account
for component predictability; (ii) industry concentration significantly explain differences in return
predictability across industries, consistent with the information-flow frictions emphasized by Hong, Torous, and
Valkanov (2007).
Journal of Financial Research (½ðÈÚÑо¿) 9, 2011,
107--121.
|
|
Markowitz Meets Talmud: A Combination of Sophisticated and Naive Diversification Strategies
with Jun Tu
(The Longer 2008 EFA version)
|
|
The modern portfolio theory pioneered by Markowitz (1952)
is widely used in practice and extensively taught to MBAs.
However, the estimated Markowitz's portfolio rule and most of its extensions not only
underperform the naive 1/N rule (that invests equally across
N assets) in simulations, but also lose money on a risk-adjusted basis in many real data sets.
In this paper, we propose an optimal combination of the naive 1/N
rule with one of the four sophisticated strategies--- the
Markowitz rule, the Jorion (1986) rule, the MacKinlay and
Pastor (2000) rule, and the Kan and Zhou (2007) rule--- as a
way to improve performance.
We find that the combined rules not only have a significant impact
in improving the sophisticated strategies, but also outperform the 1/N rule in most scenarios.
Since the combinations are theory-based,
our study may be interpreted as reaffirming the
usefulness of the Markowitz theory in practice.
Journal of Financial Economics 99, 2011,
204--215.
|
|
Predicting Market Components Out of Sample: Asset Allocation Implications
with Aiguo Kong, David
Rapach and Jack Strauss
|
|
We analyze out-of-sample return predictability for components of the aggregate market, focusing on
the well-known Fama-French size/value-sorted portfolios. Employing a forecast combination approach based on a variety of
economic variables and lagged component returns as predictors, we find significant evidence of out-of-sample return
predictability for nearly all component portfolios. Moreover, return predictability is typically much stronger for
small-cap/high book-to-market value stocks. The pattern of component return predictability is enhanced during business-cycle
recessions, linking component return predictability to the real economy. Considering various component-rotation investment
strategies, we show that out-of-sample component return predictability can be exploited to substantially improve portfolio
performance.
Journal of Portfolio Management 37, 2011, 2011, 29--41.
|
|
Cross Sectional Asset Pricing Tests
with Ravi Jagannathan and Ernst Schaumburg
|
|
A major problem in finance is to understand why different financial assets earn vastly different returns on average. In this
paper, we survey various econometric approaches that have been developed to empirically examine various asset
pricing models used to explain the difference in cross section of security returns. The approaches range from regressions
to the generalized method of moments, and the associated asset pricing models are both conditional and unconditional. In
addition, we review some of the major empirical studies.
Annual Review of Financial
Economics 2, 2010, 49--74.
|
|
Bayesian Portfolio Analysis
with Doron Avramov
|
|
This paper reviews the literature on Bayesian portfolio analysis. Information about events,
macro conditions, asset pricing theories, and security-driving forces can serve as useful priors in
selecting optimal portfolios. Moreover, parameter uncertainty and model uncertainty are practical
problems encountered by all investors. The Bayesian framework neatly accounts for these
uncertainties, whereas standard statistical models often ignore them. We review Bayesian portfolio
studies when asset returns are assumed both independently and identically distributed as well as
predictable through time. We cover a range of applications, from investing in single assets and
equity portfolios to mutual and hedge funds. We also outline existing challenges for future work.
Annual Review of Financial
Economics 2, 2010, 25--47.
|
|
Incorporating Economic Objectives into Bayesian Priors:
Portfolio Choice Under Parameter Uncertainty
with Jun Tu
(The Published Version)
|
|
Economic objectives are often ignored when
estimating parameters, though the loss of doing so can be substantial.
This paper proposes a way to allow Bayesian priors to reflect the
objectives.
Using monthly returns of the Fama-French 25 size and book-to-market portfolios and
their three factors from January 1965 to December
2004, we find that investment performance under the
objective-based priors can be significantly
different from that under alternative priors, with
differences in terms of annual certainty-equivalent
returns greater than 10% in many cases.
In terms of out-of-sample performance,
the Bayesian rules under the objective-based priors can
outperform substantially some of the best rules developed in the classical framework.
Journal of Financial and Quantitative Analysis 45, 2010,
959--986.
|
How Much Stock Return Predictability Can We Expect From an Asset Pricing Model?
|
|
Stock market predictability is of considerable interest in both academic research and investment practice. Ross (2005)
provides a simple and elegant upper bound on the predictive regression R-squared that R2 <= (1 + R_f)2
Var(m) for a given asset pricing model with kernel m, where R_f is the riskfree rate of return. In this paper, we tighten
this bound by a squared factor of the correlation between the default pricing kernel and the state variables of the economy.
Since the correlation can be substantially smaller than one, our bound can be much tighter than Ross's. An empirical
application illustrates that while Ross's bound is not binding, our bound does.
Economics Letters 108, 2010,
184--186.
|
|
Robust Portfolios: Contributions from Operations
Research and Finance
with Frank J. Fabozzi and Dashan Huang
|
|
In this paper we provide a survey of recent contributions to robust portfolio strategies
from operations research and finance to the theory of portfolio selection. Our survey
covers results derived not only in terms of the standard mean-variance objective, but also in
terms of two of the most popular risk measures, mean-VaR and mean-CVaR developed recently.
In addition, we review optimal estimation methods and Bayesian robust approaches.
Annals of Operations Research
176,
2010, 191--220.
|
|
Limited Participation, Consumption,
and Saving Puzzles: A Simple Explanation and the Role of Insurance
with Todd Gormley and Hong Liu
|
|
In this paper, we use a simple model to illustrate that the existence of a large, negative
wealth shock and insufficient insurance against such a shock can potentially explain both the
limited stock market participation puzzle and the low-consumption-high-savings puzzle that
are widely documented in the literature. We then conduct an extensive empirical analysis on
the relation between household portfolio choices and access to private insurance and various
types of government safety nets, including social security and unemployment insurance. The
empirical results demonstrate that a lack of insurance against large, negative wealth shocks
is strongly correlated with lower participation rates and higher saving rates. Overall, the evidence
suggests an important role of insurance in household investment and savings decisions.
Journal of Financial Economics 96, 2010, 331--344.
|
|
Out-of-Sample Equity Premium Prediction:
Combination Forecasts and Links to the Real Economy
with David Rapach and Jack
Strauss
(Notes on Data and Code)
|
|
While a host of economic variables have been identified in the literature with the apparent
in-sample ability to predict the equity premium, Welch and Goyal (2008) find that these variables
fail to deliver consistent out-of-sample forecasting gains relative to the historical average.
Arguing that substantial model uncertainty and instability seriously impair the forecasting
ability of individual predictive regression models, we recommend combining individual model
forecasts to improve out-of-sample equity premium prediction. Combining delivers statistically
and economically significant out-of-sample gains relative to the historical average on a
consistent basis over time. We provide two empirical explanations for the benefits of the forecast
combination approach: (i) combining forecasts incorporates information from numerous
economic variables while substantially reducing forecast volatility; (ii) combination forecasts
of the equity premium are linked to the real economy.
Top on the Most Read List as of June 2017
Review of Financial Studies 23, 2010, 821--862.
|
|
Is the Recent Financial Crisis Really a `Once-in-a-century'
Event?
with Yingzi Zhu
(The Longer working paper version)
|
|
In the recent financial crisis, the Dow Jones stock
market index
dropped about 54% from a high of 14164.53 on October 9, 2007 to a low of 6547.05 on March 9, 2009.
Alan Greenspan calls this a ``once-in-a
century" crisis. While we do not know how he drew his conclusion,
we show that the probability of a stock market drop of 50%
from its high within a century is about 90% based on the popular random walk
model of the stock prices. With a broad market index of the S&P500
and a more sophisticated asset pricing model which captures more risks in the economy,
the probability rises to above 99%. The message of this paper is that
a market drop of 50% or more is very likely in long-run stock market
investments, and the investors should be prepared for it.
Financial Analysts Journal 66 (1), 2010, 24--27.
|
|
Beyond Black-Litterman: Letting
the Data Speak
|
|
The Black-Litterman model is a popular approach for asset
allocation by blending an investor's proprietary views with the
views of the market. However, their model ignores the
data-generating process whose dynamics can have significant impact
on future portfolio returns. This paper extends, in two ways, the Black-Litterman
model to allow Bayesian learning to exploit all available
information--
the market views, the investor's proprietary views as well as the
data. Our framework allows practitioners to combine insights from
the Black-Litterman model with the data to generate potentially
more reliable trading strategies and more robust portfolios.
Further, we show that many Bayesian learning tools can now be
readily applied to practical portfolio selections in conjunction
with the Black-Litterman model.
Journal of Portfolio Management 36 (1), 2009, 36--45.
|
|
What Will the Likely Range of My Wealth Be?
Raymond Kan
|
|
The median is a better measure than the mean in evaluating the
long-term value of a portfolio. However, the standard plug-in
estimate of the median is too optimistic. It has a substantial
upward bias that can easily exceed a factor of two. In this paper,
we provide an unbiased forecast of the median of the long-term value
of a portfolio. In addition, we also provide an unbiased forecast of an
arbitrary percentile of the long-term portfolio value distribution.
This allows us to construct the likely range of the long-term
portfolio value for any given confidence level. Finally, we provide
an unbiased forecast of the probability for the long-term portfolio
value falling into a given interval. Our unbiased estimators
provide a more accurate assessment of the long-term value of a
portfolio than the traditional estimators, and are useful for
long-term planning and investment.
Financial Analysts Journal 65 (4), 2009, 68--77.
|
|
Technical Analysis: An Asset Allocation
Perspective on the Use of Moving Averages
Yingzi Zhu
(The Longer 2007 EFA version)
|
|
In this paper, we analyze the usefulness of technical analysis,
specifically the widely used moving average trading rule from an
asset allocation perspective. We show that when stock returns are
predictable, technical analysis adds value to commonly used
allocation rules that invest fixed proportions of wealth in stocks.
When there is uncertainty about predictability which is likely in
practice, the fixed allocation rules combined with technical
analysis can outperform the prior-dependent optimal learning rule
when the prior is not too informative. Moreover, the technical
trading rules are robust to model specification, and they tend to
substantially outperform the model-based optimal trading strategies
when there is uncertainty about the model governing the stock price.
Journal of Financial Economics 92, 2009, 519--544.
|
On
the Fundamental Law of Active Portfolio Management: How to Make Conditional Investments Unconditionally Optimal?
|
|
The fundamental law of active portfolio management
tells an active manager how to transform his alpha forecasts into the valued-added
of his active portfolio by using a linear strategy with active positions proportional to the forecasts.
This linear strategy is conditionally optimal because it is
optimal each period conditional on the forecasts at that
time.
However, the unconditional value-added (the valued-added over the long haul or over multiple periods)
is what usually the manager strives earnestly for.
Under this unconditional objective, the linear strategy can
approach zero value-added if the forecasts or signals have a
high kurtosis. To overcome this problem, we provide an investment
strategy that maximizes the
unconditional value-added with the optimal use of conditional information.
Our strategy is nonlinear in the forecasts, but has a simple economic interpretation.
When the alpha forecasts are high, we invest less aggressively than
the linear strategy, and when the forecasts are low, we invest more
aggressively. In this way, we tend to smooth our value-added
over time, and hence, on a risk-adjusted basis, our long-term unconditional value-added will in most cases be
substantially higher than that based on the linear strategy, particularly when the alpha forecasts experience high kurtosis.
Journal of Portfolio Management 35 (1), 2008,
12--21.
|
|
On
the Fundamental Law of Active Portfolio Management: What Happens if Our Estimates Are Wrong?
|
|
The fundamental law of active portfolio management
pioneered by Grinold (1989) provides profound insights on the
value
creation process of managed funds. However, a key weakness of the
law and its various extensions is that they ignore the estimation
risk associated with the parameter inputs of the law.
We show that the estimation errors have a substantial impact on the
value-added of an actively managed portfolio, and they can easily
destroy all the value promised by the law
if they are not dealt
with carefully. For bettering the chance of active managers to beat benchmark indices,
we propose two methods, scaling and diversification,
that can be used effectively to minimize the impact of the estimation errors significantly.
Journal of Portfolio Management 34 (4), 2008,
26--33.
|
|
Asymmetries in Stock Returns: Statistical Tests and Economic
Evaluation
with
Yongmiao Hong and Jun Tu
|
|
In this paper, we provide a model-free test for asymmetric correlations in which stocks move
more often with the market when the market goes down than when it goes up. We also provide
such tests for asymmetric betas and covariances. In addition, we evaluate the economic significance
of incorporating asymmetries into investment decisions. When stocks are sorted by size, book-to-market and momentum, we find strong
evidence of asymmetry for both the size and momentum
portfolios, but no evidence for the book-to-market portfolios. Moreover, the asymmetries can be
of substantial economic importance for an investor with a disappointment aversion preference of
Ang, Bekaert and Liu (2005). If the investors's felicity function is of the power utility form and if
his coefficient of disappointment aversion is between 0.55 and 0.25, he can achieve over 2% annual
certainty-equivalent gains when he switches from a belief in symmetric stock returns into a belief
in asymmetric ones.
Review of Financial Studies 20, 2007,
1547--1581.
|
|
Optimal
Portfolio Choice with Parameter Uncertainty
with
Raymond Kan
|
|
In this paper, we analytically derive the expected
loss function associated with using sample means and covariance matrix
of returns to estimate the optimal portfolio. Our
analytical results show that the standard plug-in approach that
replaces the population parameters by their sample estimates can
lead to very poor out-of-sample performance.
We further show that with parameter uncertainty, holding
the sample tangency portfolio and the riskless asset is never optimal.
An investor can benefit by holding some other risky portfolios that help reduce the
estimation risk. In particular, we show that a portfolio that
optimally combines the riskless asset, the sample tangency portfolio,
and the sample global minimum-variance portfolio dominates
a portfolio with just the riskless asset and the sample
tangency portfolio, suggesting that the presence of estimation risk
completely alters the theoretical recommendation of a two-fund
portfolio.
Journal of Financial and Quantitative Analysis 42, 2007,
621--656.
|
|
Estimating and Testing Beta Pricing Models: Alternative
Methods and Their Performance in Simulations
with
Jay Shanken
(A typo correction on the LR Estimator)
|
|
In this paper, we provide a comprehensive theoretical and small sample
study of the Fama and MacBeth (1973) two-pass
procedure that is fundamental in understanding to what extent
cross-sectional expected returns/values are explained by
certain factor attributes.
While existing studies use almost exclusively this procedure, we
show that alternative two-pass methods can have better small
sample performance. In addition, we provide tractable GMM
approaches that accommodate conditional heteroscedasticity of
the
data.
Moreover, the risk premium estimates and t-ratios of the Fama and MacBeth procedure
provide no information on whether the model is misspecified or not, and
they can be misleadingly interpreted if the model is indeed
misspecified. We not only provide formal model misppecification tests,
but also how that various
estimation methods are useful in detecting model
misppecification.
Journal of Financial Economics 84, 2007, 40--86.
|
|
Using Bootstrap to Test Portfolio Efficiency
with
Pin-Huang Chou
|
|
To facilitate wide use of the bootstrap method in finance, this
paper shows by intuitive arguments and by simulations how it can
improve upon existing tests to allow less restrictive distributional
assumptions on the data and to yield more reliable (higher-order
accurate) asymptotic inference. In particular, we apply the method
to examine the efficiency of CRSP value-weighted stock index, and to
test the well-known Fama and French (1993) three-factor model. We
find that existing tests tend to over-reject.
Annals of Economics and Finance 7, 2006, 217--249.
|
|
Portfolio Optimization under Asset Pricing Anomalies
with
Pin-Huang Chou and Wen-Shen Li
|
|
Fama and French (1993) find that the
SMB and the HML factors explain much of the
cross-section stock returns that are unexplained by the CAPM,
whereas Daniel and Titman (1997) show that it is the characteristics of the stocks that are responsible rather than the
factors.
But both arguments are largely based only on expected return comparisons, and little is known about how important each of
the two explanations
matters to an investor's investment decisions in general and portfolio optimization in particular. In this paper, we show that a
mean-variance maximizing investor who exploits the
asset pricing anomaly of the CAPM
can achieve substantial economic gains than simply holding the market index. Indeed, using Japanese data over the period
1980-1997,
we find that the optimized portfolio constructed from
characteristics-based model and based on the first 200 largest stocks is the best performing one and
has monthly returns more than 0.81% (10.16% annualized)
over the Nikkei 225 index with no greater risk.
Japan & The World Economy 18, 2006, 121--142.
|
|
A New Variance Bound
on the Stochastic Discount Factor
with
Raymond Kan
|
|
In this paper, we construct a new variance bound on any stochastic
discount factor (SDF) of the form m=m(x) where x is a vector
of random state variables. In contrast to the well known
Hansen-Jagannathan bound that places a lower bound on the variance
of m(x), our bound tightens it by a ratio of (1/ρx,m0)2,
where ρx,m0 is the multiple correlation coefficient
between x and the standard minimum variance SDF, m0. In many
applications, the correlation is small, and hence our bound can
be substantially tighter than Hansen-Jagannathan's. For
example, when x is the gross growth rate of consumption, based
on Cochrane's (2001) estimates of market volatility and
ρx,m0, the new bound is 25 times greater than the Hansen-Jagannathan
bound, making it much
more difficult to explain the equity-premium puzzle based on
existing asset pricing models. Another example is
applying the new bound, with the growth rate of consumption as
a state variable, to the 25 size and book-to-market sorted portfolios
used by Fama and French (1993), then it is more than 100 times greater
than the Hansen-Jagannathan bound.
Journal of
Business 79, 2006, 941--961.
|
|
Data-generating Process Uncertainty:
What Difference Does It Make in Portfolio
Decisions?
with
Jun Tu
|
|
As the usual normality assumption is firmly rejected by the data, investors encounter a data-generating
process (DGP) uncertainty in making investment decisions. In this paper, we
propose a novel way to incorporate uncertainty about the DGP into portfolio analysis. We
find that accounting for fat tails leads to nontrivial changes in both parameter estimates and
optimal portfolio weights, but the certainty–equivalent losses associated with ignoring fat tails
are small. This suggests that the normality assumption works well in evaluating portfolio
performance for a mean-variance investor.
Journal of
Financial Economics 72, 2004, 385--421.
|
|
What Determines Expected
International Asset Returns?
with
Campbell Harvey and Bruno Solnik
|
|
This paper characterizes the forces that determine time-variation in expected
international asset returns. We offer a number of innovations. By
using the latent factor technique, we do not have to prespecify the sources of
risk. We solve for the latent premiums and characterize their time-variation.
We find evidence that the first factor premium resembles the expected return
on the world market portfolio. However, the inclusion of this premium alone
is not sufficient to explain the conditional variation in the returns. We find
evidence of a second factor premium which is related to foreign exchange risk.
Our sample includes new data on both international industry portfolios and
international fixed income portfolios. We find that the two latent factor model
performs better in explaining the conditional variation in asset returns than
a prespecified two factor model. Finally, we show that differences in the risk
loadings are important in accounting for the cross-sectional variation in the
international returns.
Annals of Economics and Finance 3, 2002, 83--127.
|
|
On Rate of Convergence of Discrete-time Contingent Claims
with
Steve Heston
|
|
This paper characterizes the rate of convergence of discrete-time multinomial option prices.
We show that it depends on the smoothness of option payoff function, and is much lower than commonly believed because the
payoff functions are often all-or-nothing type and not continuously differentiable. We propose two methods, one of which is
to smooth the payoff function, that help to yield the same rate of convergence as smooth payoff functions.
Mathematical Finance 10, 2000, 53--75.
|
|
Investment Horizon and the Cross Section of Expected Returns: Evidence from
the Tokyo Stock Exchange
with
Pin-Huang Chou
and Yuan-Lin Hsu
|
|
Using data from the Tokyo Stock Exchange, we study how beta, size, and
ratio of book to market equity (BE/ME) account for the cross-section of expected stock returns over different lengths of investment
horizons. We find
that beta, adjusted for infrequent trading or not, fails to explain the cross-section
of monthly expected returns, but does a much better job for horizons over half-
and one-year. However, either the size or the BE/ME alone is still a significant
factor in explaining the cross-section expected returns, but the size significantly
diminishes for longer horizons when beta is included as an additional independent
variable.
Annals of Economics and Finance 1, 2000, 79--100.
|
|
Security Factors as Linear
Combinations of Economic Variables
|
|
A new framework is proposed to find the best linear combinations of economic
variables that optimally forecast security factors. In particular, we obtain such combinations
from Chen et al. (Journal of Business 59, 383--403, 1986) five economic variables,
and obtain a new GMM test for the APT which is more robust than existing tests. In
addition, by using Fama and French's (1993) five factors, we test whether fewer factors
are sufficient to explain the average returns on 25 stock portfolios formed on size and
book-to-market. While inconclusive in-sample, a three-factor model appears to perform
better out-of-sample than both four- and five-factor models.
Journal of Financial Markets 2, 1999, 403--432.
|
|
Testing Multi-beta Pricing Models
with Raja Velu
|
|
This paper presents a complete solution to the estimation and testing of multi-beta
models by providing a small sample likelihood ratio test when the usual normality
assumption is imposed and an almost analytical GMM test when the normality assumption
is relaxed. Using 10 size portfolios from January 1926 to December 1994, we reject the
joint efficiency of the CRSP value-weighted and equal-weighted indices. We also apply the
tests to analyze a new version of Fama and French [Fama, E.F., French, K.R. 1993.
Common risk factors in the returns on stocks and bonds. Journal of Financial Economics 33, 3–-56] three-factor model in addition to two
standard ones, and find that the new
version performs the best.
Journal of Empirical Finance 6, 1999, 219--241.
|
|
A Critique of the Stochastic Discount Factor Methodology
with Raymond Kan
|
|
In this paper, we point out that the widely used stochastic discount factor (SDF) methodology ignores a fully specified model
for asset returns. As a result, it suffers from two potential problems when asset returns follow a linear factor model. The
first problem is that the risk premium estimate from the SDF methodology is unreliable. The second problem is that the
specification test under the SDF methodology has very low power in detecting misspecified models. Traditional methodologies
typically incorporate a fully specified model for asset returns, and they can perform substantially better than the SDF
methodology.
Journal of Finance 54, 1999, 1021--1048.
|
|
Going to Extremes: Correcting Simulation Bias in Exotic Option Valuation
with Phil Dybvig and David Beaglehole
|
|
Monte Carlo simulation is widely used in practice to value exotic options for which analytical formulas are not available. When
valuing those options that depend on extreme values of the underlying asset, convergence of the standard simulation is slow as
the time grid is refined, and even a daily simulation interval produces unacceptable errors. This article suggests
approximating the extreme value on a subinterval by a random draw from the known theoretical distribution for an extreme of a
Brownian bridge on the same interval. This approach provides reliable option values and retains the flexibility of simulations,
in that it allows great freedom in choosing a price process for the underlying asset or a joint process for the asset price,
its volatility, and other asset prices.
Financial Analysts Journal 53, 1997,
62--68.
|
|
Temporary Components of Stock Returns: What Do the Data Tell Us?
with Chris Lamoureux
|
|
Within the past few years several articles have suggested that returns on large equity portfolios may contain a significant
predictable component at horizons 3 to 6 years. Subsequently, the tests used in these analyses have been criticized
(appropriately) for having widely misunderstood size and power, rendering the conclusions inappropriate. This criticism however
has not focused on the data, it addressed the properties of the tests. In this article we adopt a subjectivist analysis -
treating the data as fixed - to ascertain whether the data have anything to say about the permanent/temporary decomposition.
The data speak clearly and they tell us that for all intents and purposes, stock prices follow a random walk.
Review
of Financial Studies 9, 1996, 1033--1059.
|
|
Measuring the Pricing Error of the Arbitrage Pricing Theory
with John Geweke
|
|
This article provides an exact Bayesian framework for analyzing the arbitrage pricing theory (APT). Based on the Gibbs sampler,
we show how to obtain the exact posterior distributions for functions of interest in the factor model. In particular, we
propose a measure of the APT pricing deviations and obtain its exact posterior distribution. Using monthly portfolio returns
grouped by industry and market capitalization, we find that there is little improvement in reducing the pricing errors by
including more factors beyond the first one.
Review
of Financial Studies 9(2), 1996, 553--583.
|
|
Time-to-Build Effects and the Term Structure
with Jack
Strauss
|
|
This paper shows that real macroeconomic variables have power in predicting movements in the term structure of interest rates,
complementing
recent studies on the links of structure to expected stock returns. We find that up to 86 percent of the variation in the
term premia are due to changes in the macroeconomy. The predictive power can be attributed to time-to-build effect of
investments.
Journal of Financial
Research 18, 1995, 115--127.
|
|
Small Sample Rank Tests with Applications to Asset Pricing
|
|
This paper proposes small sample tests for rank restrictions that arise in many asset pricing models, economic fields and
others, complementing the usual asymptotic theory which can be unreliable. Using monthly portfolio returns grouped by industry
and using two sets of instrumental variables, we cannot reject a one-factor model for the industry returns.
Journal of Empirical Finance 2, 1995, 71--93.
|
|
Analytical GMM Tests: Asset Pricing with Time-Varying Risk Premiums
|
|
We propose alternative generalized method of moments (GMM) tests that are analytically solvable in many econometric models,
yielding in particular analytical GMM tests for asset pricing models with time-varying risk premiums. We also provide
simulation evidence showing that the proposed tests have good finite sample properties and that their asymptotic distribution
is reliable for the sample size commonly used. We apply our tests to study the number of latent factors in the predictable
variations of the returns on portfolios grouped by industries. Using data from October 1941 to September 1986 and two sets of
instrumental variables, we find that the tests reject a one factor model but not a two-factor one.
Review
of Financial Studies 7, 1994, 687--709.
|
|
Asset Pricing Tests Under Alternative Distributions
|
|
Given the normality assumption, we reject the mean-variance
efficiency of the Center for Research in Security Prices
value-weighted stock index for three of the six consecutive ten-year
subperiods from 1926 to 1986. However, the normality assumption is
strongly rejected by the data. Under plausible alternative
distributional assumptions of the elliptical class, the efficiency
can no longer be rejected. When the normality assumption is violated
but the ellipticity assumption is maintained, many tests tend to be
biased toward over-rejection and both the accuracy of estimated beta
and R2 are usually overstated.
Journal of Finance 48, 1993, 1927--1942.
|
|
International Asset Pricing with Alternative Distributional Specifications
with Campbell Harvey
|
|
The unconditional mean-variance efficiency of the Morgan Stanley Capital International world equity index is investigated. Using
data from 16 OECD countries and Hong Kong and maintaining the assumption of multivariate normality, we cannot reject the
efficiency of the benchmark. However, residual diagnostics reveal significant departures from normality. We test the sensitivity
of the results by specifying error structures that are t-distributed and mixtures of normal distributions. Even after relaxing
the i.i.d. assumption, we cannot reject the mean-variance efficiency of the world portfolio. Our results suggest that differences
in country risk exposure, measured against the MSCI world portfolio, will lead to differences in expected returns.
Journal of Empirical Finance 1, 1993, 107--131.
|
|
Small Sample Tests of Portfolio Efficiency
|
|
This paper presents an eigenvalue test of the efficiency of a portfolio when there is no riskless asset, complementing the test
of Gibbons, Ross, and Shanken (1989). Besides optimal upper and lower bounds, an easily-implemented numerical method is
provided for computing the exact P-value. Our approach makes it possible to draw statistical inferences on the efficiency of a
given portfolio both in the context of the zero-beta CAPM and with respect to other linear pricing models. As an application,
using monthly data for every consecutive five-year period from 1926 to 1986, we reject the efficiency of the CRSP
value-weighted index for most periods.
Journal of Financial Economics 30, 1991, 165--191.
|
|
Algorithms for the Estimation of Possibly Nonstationary Time Series
|
|
This paper presents efficient algorithms for computing time series projections, the maximum likelihood function and its
gradient in possibly nonstationary vector times series model (VARMA).
Journal of Time Series Analysis
13, 1991, 171--188.
|
|
Bayesian Inference in Asset Pricing Tests
with Campbell Harvey
(An Unpublished TechAppendix)
|
|
We test the mean-variance efficiency of a given portfolio using a Bayesian framework. Our test is more direct than Shanken's
(1987b), because we impose a prior on all the parameters of the multivariate regression model. The approach is also easily
adapted to other problems. We use Monte Carlo numerical integration to accurately evaluate 90-dimensional integrals.
Posterior-odds ratios are calculated for 12 industry portfolios from 1926–1987. The sensitivity of the inferences to the
prior is investigated by using three different distributions. The probability that the given portfolio is mean-variance
efficient is small for a range of plausible priors.
Journal of Financial Economics 26, 1990, 221--254.
|
|
|
|
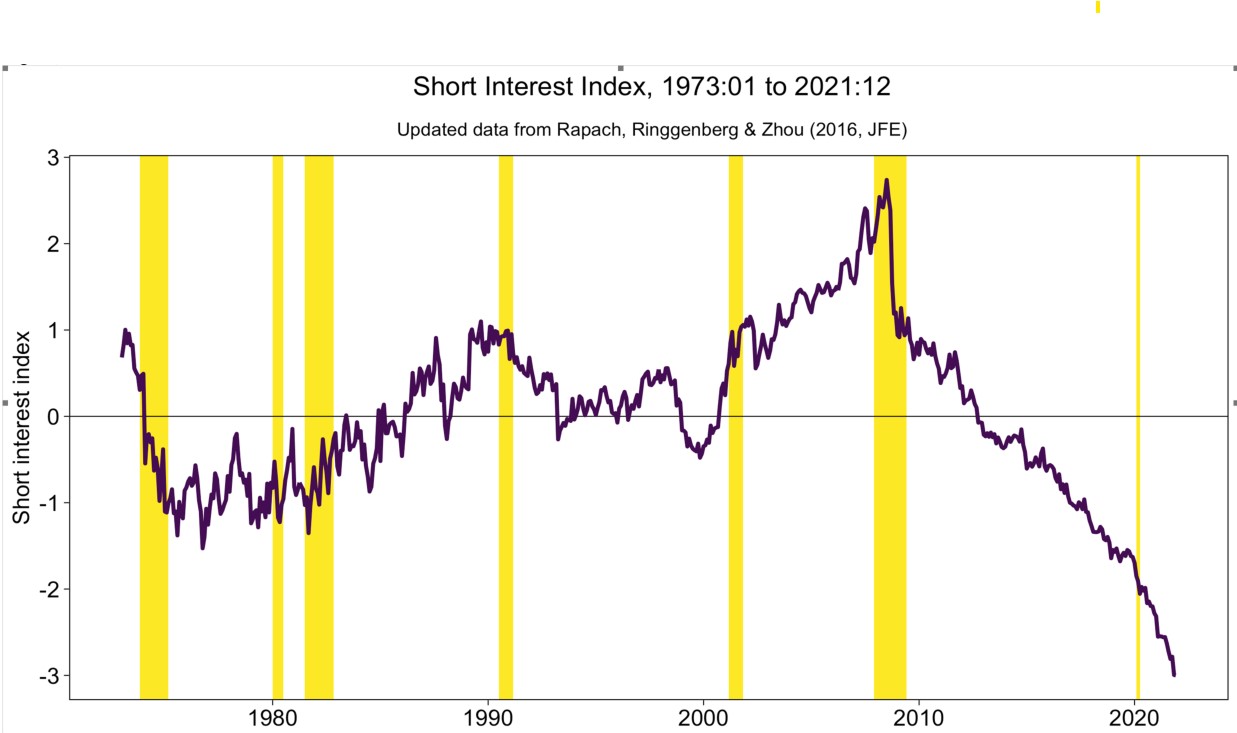